Saturday, June 20, 2015

Trading Journal

This is a piece from my trading journal, excuse the typo's.

Trading Journal
6/19/15
The market is being very choppy which makes it a decent environment to structure Iron condors. However, the rise in the /VX future and the change in the futures curve away from contango is making me nervous. However, because any particular direction is unclear to me, I butterflied off short SPX puts for a credit that I was holding on to allowing me a risk free bearish trade with a “sweet spot” area of 1975-2030. This trade will benefit from any downside move. As for other positions, I am holding my pairs trade in EWZ and EWW which I am waiting on, and I have a small position in TWTR looking for upside. I could imagine the stock could easily have a quick upside move on a piece of news considering the depressed price, and the options are cheap because of low volatility.

I do have a few investments primarily in oil. I do not have any current thoughts on this besides the fact I am simply allowing the calls to decay.  

Monday, August 11, 2014

Trading With Edge (Being the House)

Trading is all a game of math and statistics, but most people don't think about it properly. Most traders only think about either the reward/risk ratio or their probability of profit, but in reality it is somewhere in between. Options trading is quite a bit like being a casino. You hope for many small occurences with a small edge and overtime it will add up to be big amounts of dollars, and you look for trades than can have a big edge and pile because they rarley occur. What many people do not realize is that a Casino only has   1-2% edge over the players. However, in the markets you will find small edges and very large edges, so your betting size makes a difference. Casinos understand this concept well.

Kelly % = W – [(1 – W) / R] 

W  = Probability of Profit
R = Win/Loss


The Kelly Criterion illustrates this concept very well. It shows you what ones risk as a % of their capital should be. For example, if a trader has a W of .85 and a .5 R (.5/1) then they have a Kelly Criterion of .55 or 55% of their capital can be used to make this trade. However, lets say they have a W .6 and an R of .5 (.5/1) they will have a Kelly of -.2 or -20% of your capital. This is because there is no edge in the long run considering this certain trade. I could run several tests and find this almost never works; therefore, the returns are sharply negative. Options sellers need to keep this in mind because it  means letting your losses run is not an acceptable strategy, and since your risk is greater than your reward on a single trade the optimal loss point is something that need to be considered.

However, the premuim buyer also needs to keep the Kelly Criterion in mind . If they are long an option with a .25 W and a 3 (.75/.25) R then that trader can only break even (Kelly Criterion is 0), and after commisions and slippage they would be a small loser. The premuim buyer has to have an understanding of their probability of profit compared to their risk reward because the trader might make money over 10 or even 100 trades, but over 10,000 trades it is extremley unlikley.

If one want to trade like a Casino or the house one has to have a very good understanding of edge compared to ones sizing. If we assume returns are distributed randomly even with a large edge returns can be very volatile. Sizing is key because the bigger the edge the larger the optimal position size is; the smaller the edge optimal postion size also becomes smaller, but considering returns are randomly distributed the trader needs to have many occurences, but always have edge working in ones favor. If the trader has proper sizing the volatility in returns is much less because little trades can work for the trader overtime while trades with much larger edge can provide the meat of ones returns while the small trades are paying little bit of money every month or every year.

The reason this concept is so important is even with edge a trader can have periods of time where they peform poorly. This is due to the random element in distribution of returns. This does not mean the markets are a "random walk", but it does mean we can not predict the future, and we can only play the numbers we see now.

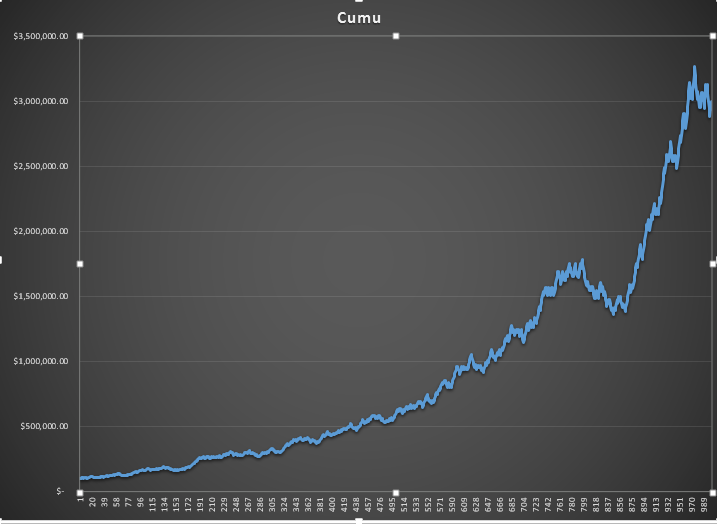
For example, the chart below illustrates a simulation of an options trade with a 55% probability of sucsess and a reward to risk of 1 and 2% of the portfolio is used. As shown, the returns over 1000 occurences is muted. There is a low chance of this with this edge, but there are times when your "edge" does not work.


In the chart below, I am using the same 55% probability of profit and a Reward/Risk ratio of 1. The returns are ridicoulously huge for such a low risk strategy; this also is unlikley.


However, As we get to several different tests the results are closer to each other.


The data seems to illustrate the  returns reaped from trading like a casino does business o. However, the casino understands size well also. That is why they put table limits in place, and this is why us traders need to always need to stick to our risk guidlines. There can be wild girations in returns even over 1000 occurences or more. The biggest mistake many traders make besides improper size is changing strategies when something doesn't work. If you have found positive EV in a certain strategy stick to it because you can have large volatility in returns during certain periods of time, but over many years and occurences you are going to find yourself with a large positive return. This, for example, is why buy and hold works or selling index premuim works so well. They both have edge, and it is only a matter of the risk you are willing to take and proper sizing.

Saturday, July 12, 2014

Covered Strangle (Across Multiple Indices)


Here are the two major US equity index ETF's the SPY (S&P 500) or the IWM (Russel 2000). Now I have been considering the actualy value of say historical volatility, and I have come to a conclusion that I would rather use ATR than historical volatility which is a topic I should get into with a different post. However, my bullish for the next 5 days or so is slightly bullish to neutral. I am much more bullish IWM than I am bullish SPY (Completley Neutral), but I am witnessing the SPY seems to be a more suitable premuim sell in this case since the Implied Volatility is above the ATR (what I am using for historical volatility, but to reduce capital anything I sell will have wings on it.

 On the case of buying IWM stock, considering the 3 days down and 2 closes above the low of the day we have an extremley bullish upside historical criteria.

Below is a performance chart of the pattern described above. Bought on the first day the signal was intiated and sold 5 trading days later (1 week). The historical stock trade that included leverage in IWM had a 69% win rate.


A trade that I like is a covered strangle trade across indices for  a short duration of time possibly 2 weeks on the strangle (I will Iron Conderize it by buying some wings as protetion) so I can get a decent premuim at the 1 std dev move, and then I will either buy IWM stock or do a synthetic stock trade using options (Short ATM put, Long ATM Call) to reduce capital once again.

Besides this trade I have very few positions all based of statistical criteria in stocks I follow closely. There a few short premuim trades available at the moment, so I am playing directional and long premuim directional. Long stock seems suitable in TSLA, AMZN, and LNKD.


Thanks,
Alex

Monday, July 7, 2014

NQ Makes for a Different Story than Usual

NQ (NQ Mobile) not to be confused with the /NQ futures (Nasdaq futures) has been a interesting trading vehicle to watch latley. They have over and over again moved there earnings back and back. I have been watching the ATM strangle. I bought iton 7/2/14 before the expected earnings report that didn't come out. I had to pick it up beause it was extremley cheap trading for around .35 -.40 in front of earnings. The reason for this is nobody knew/knows when the actual earnings are/were going to come out. I had a chance intraday to actually sell the strangle for a decent profit, but most of my readers know what my deal with time decay is. Anyway, I have been watching it the day after the expected earnings report which hasn't come yet and the straddle/ATM strangle seems to price approximately the same thing everytime and rally from that level.


The next question is why would I be selling NQ volatility at a 97% IV Percentile. The reason for this is I really don't care. The first line in the sand is that look at the price movement. Implied Volatility hasn't been correct on this stock except for that short period of time in novemeber and back in July and August of 2013. But even that isn't the real reason. The reason is we have the market underpricing options around an even because of the uncertainty of timing of this event. However, we continue to make large unpredictable moves in the underlying paying for most of the decay.

Lets pretend we do but the atm straddle or strangle on 7/9 and the earnings come out. The market does not know if they really will come out or not, so it will be a cheap trade. This stock is either going to go bankrupt (near 0) or it might announce something really good and the stock will rocket. The stock rocketing is the potentially most profitable trade, but it is the least probable. Therefore, the shortside trade is the most probable to be sucsessfull, but it has the least profit potential. This makes the straddle or ATM strangle make a lot of sense.

However, if there is some announcement or piece of news that will end up making sure earnings are on a certain date the options will be over priced again. I prefer the selling put trade because it is the safest if you want to do it. The stock could rocket or go to 0 and your risk is defined with the put. In the case of the call side. The stock could just 100,200, or 300 % at any given moment for any give reason. In stocks like these the downside is always much slower often and the upmoves that are news drive can be huge.

I do warn people who go out and do this trade. Do not do it with large size. I do this in the context of my overal portfolio. The main risk in the trade is time decay, and that is the most important element of my portfolio. How much time decay over my directional risk I have. In a trade like this I will risk no more than 1% of my portfolio and probably about .4-.5% of my overall portfolio.

Email me with questions at alex.optionstrading@gmail.com

Monday, June 2, 2014

Interesting Markets

These make for some very interesting markets at all time highs and low volatility. However, the general feel of the market has been very much different than last year which is good. First of all small caps (TF/RUT/IWM) and Nasdaq (NQ/QQQ/NDX) have been very weak lately. The NQ just rallied with the ES, but it has been a great scalping vehicle, and it also has been a very good vehicle for strangles while the ES/SPX has not been nearly as good. The cyclical action has been okay in the ES but we still are having the grind higher tendency which is something I do not care for. However, we have seen quite a bit of volatility in major names (TSLA, NFLX, AAPL, GOOG, TWTR, etc). Those names have been pretty good, and macro markets have been good. Even if I have not had a focus on some of these bonds, currencies, and commodities have all had decent trading volatility.

As for the US indices, I think we are going to need a catalyst to get some volatility going. I have been long a few Vix calls, but I am going to dump those positions if we do not catch something within the next week. However, I will be selling calendar spreads in the VIX. Vix options are based of the futures so when volatility goes up front month vol will go up much more than back month vol, and these calendars can trade at huge credits when we get vol expansion. I will sell these as cheap protection, but I am remaining long theta and long some vega. My net portfolio Prob of Profit has been lowered by the long vix but the analzye tab/models do not take some of these things into account. The premium sale for a while is going to be IWM. I have a relatively large position in IWM, but it is skewed to the downside for the purpose of protection. This continues to be of interest as volatility percentile in IWM is consistently above the vol in SPY/SPX lately, so the options are relatively expensive, so I am selling them. However, do keep in mind that ATM premiums as a % of the SPX price are at 5 year lows.

 I also see some interesting trading in bonds and currencies. Trading the fear in the euro for example is acceptable and even if the ECB meetings on Thursday take a bad I am still trading euro from the long side via calls in FXE or the 6E futures options. I am buying options in this case because considering what kind of move could happen the longer term options (108 days to expiry) seem cheap. Bonds will also have some interesting movement because I see slowly these assets creeping up as market participants lose interest in equities and move into less risky safer assets such as bonds. I will be buying the dip and playing options is going to depend on vol and binary events that can occur in these markets.

Lastly, commodities are also of interest. Agriculture could also be in play in the coming months and into the harvest season and summer. I am thinking about a direction, but go with the weather trend. I think Corn could be a buy as we are heading into the summer months, and if we have a hot summer then it will get interesting. I prefer directional trades in this case because all the options seem to be fairly priced. I am also going to be selling premium in oil when I can. It is more cyclical than people give it credit for and right now it is out of the picture of news.

Monday, May 5, 2014

Interesting Markets

Interesting markets, still down some money because of crap I had to carry over from 2013, but the horizons are set for good returns. We are back in a traders market. Range bound and cyclical. I have a feeling the next few months are going to be like this, but this is the market forming a long term top.

The chart above is a weekly chart, and as you can see it takes months for tops to form. However, be careful because even before the collapse we see extreme volatility, and this is why we tend to maintain a slightly short delta bias. Long VIX calls are always decent hedges considering the tail risk. Sometimes pairs trades work; selling QQQ volatility and buying SPY volatility which was a great trade last week if you skewed the pair to the short side enough is a good example. I personally though have been keeping the large positions in the indices. If you have followed my trades on dough.com you will see many trades being QQQ trades, and that is just me maintaining basic short strangles. If we see the VIX fall anymore you will likely see me begin buying QQQ volatility including puts, straddles, and long bearish diagonals. The reason for this is when we get a bad downside explosion the Nasdaq tends to explode to the downside at a faster rate. If we see the 12/11 print in the VIX,  I will begin initiating parts of the trade

As for my personal stuff it has been indices and lots of weekly or shorter term trades. They have been working for me much better. I have put out several weekly ratio trades along with a few other custom orders. These have been extremely profitable. My large positions have generally been in the QQQ and a few in the SPY. Strangles have been doing well lately, but I also have to do wide iron condors because of the capital requirements with strangles. The weekly trades have been undefined risk because that is what works for me. In larger stocks I will buy a strike wide out to define the risk, but undefined is my wheelhouse.

I will go into a specific article later about what my weekly trades look like. A few other guys that have really good weekly trades are the Shadow Traders. I do not get anything at all for promoting them, but they do have some interesting stuff. You can find them at shadowtrader.net or Shadow Trader uncovered on tastytrade.com

Wednesday, March 19, 2014

Why I Chose Trading and My Grind to Profitability

I haven't written an article in a little while, so I decided to write something different. So why did a choose trading?

I have always been very entrepreneurial. The first thing I started with was an allowance. I had a choice I could receive all the change in my dads pocket everyday or I could receive an allowance. This brought me to thinking about risk versus reward. Do I want a steady income or something less reliable with more upside. I took the upside. Why you ask? I was FIVE what risk did I really have. If I wanted something I could just ask my mom to buy it, and I wouldn't have to spend a dime to buy it. Now to be fair, I don't think I was necessarily thinking through all of this at that age, but I think I grasped the idea.

3 years later after I got out of the being "King of the World" stages I became interested in business and finance. I was fascinated about how you could make money. Therefore, I started my own business. Now at age 8 I was a little shy and had limited resources, so I was kind of stuck with illiquid and unfair markets....my parents (they could charge any price the wanted). However, I decided to start with dish washing. I was making a $1 a day from this at dinner time. Okay great that is $365 a year which went into my savings. Then I decided to have a lawn watering business. Okay great no cost and plain revenue takes 20 minutes. That brought in $282 (140 days a year of watering * $2 per job). Then, being the evil child that I am, I sold "information" to my mom of the daily happenings at school, which I probably made $.50 a reports, and I sold about 3 reports a week (begining, middle, and end of the week) which ends up at $78 a year. So we are at a minimum of $726 a year + the income I was making from my dads change (which if you think about is a lot like options income investing, if the insurance doesn't pay I don't get my premium). So, I was making pretty decent for a 8 year old at this point. I decided to package this into a "giant" conglomerate, so I could use cash from one company to fund another company. Then the question came up. What do I do with the extra cash?

This shot me right into the trading world. Within a few weeks, I had decided I needed a brokerage account, and I had to invest. I spent a 1/2 year learning and not doing as single trade until January 2009. In January 2009, with a $500 trading account, I bought shares of 5 shares of INTU at $ 52. I ended up scratching the trade, but it was a great experience. So, at the end of 2009 I ended up going through some decent pain, and I scratched the year. I also decided from just that volatility that I couldn't make big returns from such a small account, but I could prove that I could consistently the outperform the market, and I did making 20 % + with relatively small draw downs in 2010 and the same in 2011 of less than 10% unfortunately it was to difficult to leverage in such small accounts. Today, I have learned to simply use more leverage for a higher return

Now by the end of 2011 I had decided that I am going to learn options trading. I also began trading longer term and mostly macro markets in 2012 with a $2500 trading account. By the summer of 2012 I was almost solely trading macro directional options buying ITM options, and a pretty non strategic approach. I was basically managing winners and playing the trend, in my dads IRA account, and my own account. After the summer of 2012, I began taking on a strategic approach, and I was also doing pretty well with that, and I ended the year in my dad's IRA in + 15% with a max drawdown of 3% (My dad has a limited risk tolerance so I cut down on leverage big time), and I made just a little in my small account ending with $4500, but I put in contributions. I think I had the best year ever here from a risk to reward standpoint. To put it in perspective, in a higher risk trading account I would use 3x leverage of a low risk IRA with a return of 45% and a draw down of 9%.

Now I am going to fast forward into summer of 2013. At this time I was up 4% on the year in a higher risk margin account that I was willing to take more risk in. Then I got whipsawed on deltas, volatility sucked, and I got overly short deltas. It ended up being the first year the market tested me into losing money, but I learned 100x what I did before all the previous year because nothing teaches you more than being tested.

Now in 2014, I have been doing much better. My portfolio volatility has decreased and returns have been much more consistent. My goal is to beat my 5/1 risk to reward in 2012.


Monday, February 17, 2014

When is There Not An Edge to Sell Premuim?

In the financial industry, the likelihood of outlier moves has been a constantly argued subject. This is especially true when it comes to derivatives products, specifically options. How often do the 3 std deviation, 2 std deviation, or even 25 std deviation events occur? Now I do not want to turn this into a mathematical article at all. In fact the way I will look at this just might make a mathematician cringe. However, lets take a look into some of the facts.

  1. When volatility is above its mean to is a time to sell volatility.
  2. The seller of the options wants implied volatility to forecast greater moves than realized volatility will be.
  3. Not all stocks are good products for premium sellers because implied volatility is consistently wrong in predicting the actual moves/volatility.
Therefore, lets take a look at the opportunity this presents us. As we all know, many individual stocks are much more volatile than the stock market indices. This means historically indices have performed well for the short premium side not including some large outliers (i.e 2008-2009 crisis). Despite this, historical volatility tends to stay above implied volatility most of the time. This means volatility is low and continues to contract. The large opportunities in indices come only when there are large discrepancies in the volatility. However, this is looking at it on a long-term level.


However, if we were to expand our range to more range bound volatile indices like emerging and global markets we have more risk, but we have much more decent opportunity of implied volatility outweighing realized volatility.


If we were to sell premium in global indices we would overall have the edge. Even statistically index short premium works (You would especially know if you have ever watched the Karen the Super trader interviews). However, in individual stocks, commodities, currencies, and extremely volatile markets these rules do not always hold true. In fact, we will often see outliers where long premium makes sense. These are often the high flying stocks like TSLA or NFLX. Sometimes they are even commodities such as Natural Gas. However, overall short premium still wins, but the premium sellers (usually me) can get burned severely in these underlyings that have such large moves.


What we also must understand is that stocks/markets that behave this way take a long time to mean revert. For example, TSLA has consistently had a discrepancy of realized volatility being much higher than implied for months (you are looking at weekly charts BTW). It is also the same with NFLX. These stocks are premium buying stocks, and these are stocks that I try to avoid selling volatility in. However, when the discrepancy goes the other way their is opportunity.

This is also how I like to use historical volatility in conjunction with IV Rank. I try to look at both before I make a decision. This is especially true when I try and enter a core position where I plan to be short for a while because their is a large discrepancy. My point in all of this is simply "make sure you being paid for the risk you are taking." I always prefer short premuim and even with "undefined risk", but I don't want to be caught in those scary outliers.

Also, I suggest you read this article from Al Sherbin. It is some very interesting views on AAPL historical distributions.
 
Al's Calls of the Day

Thursday, February 13, 2014

Patience in the Options Markets

Trading options is quite a bit different than any other trading instruments. In most trading instruments you are looking for more of a instantaneous profit or loss, or in other words instant satisfaction (instant being more quickly). However, the options markets are much more about the likelihood of the move (volatility) and time.

Options decay with time going by, but that is just it. Time takes time. Traders have to wait for time to go by. This is the opposite for the premium buyer, but this person simply wants to bet on direction, and therefore is not a strategic trader (not necessarily a bad thing if it makes money). However, strategic options traders need either volatility to kick in their way, or time to go by. Both of these takes time has volatility grinds down and theta takes time. With undefined risk these factors tend to come in very quickly because you are taking more risk. However, with spreads you have to be very patient. Most spreads that have defined risk will take much longer for both volatility and time to come in because the trader of the spread is taking much less risk, so they give up the risks that come with being naked(Quiet strange minds!). Therefore, you have to be patient when trading options simply because of the factors involved.

 The general rule when it comes to spreads is MANAGE YOUR WINNERS, and be very patient. However, if you trade with spreads being core positions I would say BE SLOW TO ADJUST TRADES. The trader has to give time to let an options spread work for them, and follow their exact rules. If you take the trade off at 50% of max profit then do that. If you repair the trade be slow to do so; therefore, time can work in your favor while you are waiting.

Saturday, February 1, 2014

MA and C Trade

I talked about a volatility pairs trade in my last post, and I got a great response on it. Therefore, I am going to take a look at another one. MA (Mastercard) and C (Citigroup) are two stocks that are both in the banking/Financial industry. Both of their earnings reports have also been released, so there volatility is not pumped because of the binary event risk. However, both their volatilities are at extremes, and these stocks have a correlation of (.63).

As you can see, C has a very high IV Rank, and MA has a very low IV Rank; therefore, they are both at volatility extremes. However, if you look up top there is another indicator that shows both at very different extremes. This is a model I have built that looks into volatility extremes. When the blue line is equal to green the model is telling me that it is more advantageous to buy volatility, and red means it is more advantageous to sell volatility. In this case, the model is looking more medium term extremes, and as shown above MA is a great long volatility play, and C is a great short volatility play. This indicator is what interests me instead of IV Rank when it comes to volatility pairs trades.

Now there were a couple of trades I was looking at to put this on. The first one was selling a Citigroup iron condor (.61 credit) 3x MA, and buying a MA iron condor (1.44 debit). However, I do not like that trade because also like to play these directionally. Instead, I was looking to sell a put spread in C and buying a put spread in MA.

Position I will try to take:
C Strikes: Short 47/Long 45 MAR 14 .75 credit (2x MA)
MA Strikes: Long 77.5/Short 75.5 MAR 14 1.08 Debit (1x)

This overall position is then short volatility and long delta in C. It is also short delta in MA and long volatility. However, I did sell more C put spreads than I bought MA put spreads. The reason for this is I prefer to be overall short volatility when I do this, due to my general short volatility bias. However, I wish to know what the overall position risk looks like, so I understand I am setting up the trade properly. I do this by beta weighting the positions against the SPX, and then looking at what those overall trades look like against an index.

Below is the SPX beta weighted position of C and MA:
I will be looking to put this trade on monday morning. The mechanics for me is to let the trade sit, and find a time to manage the winner, as you can not hedge an already hedged position (it is hedged because it is a pair). However, if you do this trade you have to STAY SMALL! You need to give this strategy time to work for you. GOOD LUCK TRADING!

Sunday, January 26, 2014

Index Volatility Pairs Trade


If you have been watching the markets you know the VIX has shot up very fast very quickly in the past few days. The Vix has worked its way up to 18 from a low of around 11. This means many  indices have a high IV_Percentile. I am aware that IV_Percentile is not perfect; however, it is a good indicator of where volatility is compared to its own range. The SPY/SPX vol percentile has reached about 78%. This means volatility is over extended. However, we have had a decent down move in the past few days making a new low for the year. This puts a lot of risk in the water of where volatility might go or where the stock market might go.


This risk on the table allows for a very interesting opportunity. I do not pretend to know where the market will go, and I do not know where volatility will go. However, I do like to trade relationships. Now we have SPX/SPY volatility trading in the the 78th percentile, but we have IWM and QQQ trading in the mid-60's considering percentile. What this is telling me is that small caps and tech stocks are saying that there is much more room for vol expansion than the larger stocks are. In other words, the high volatility stocks that often make the first move are saying that there is room for volatility expansion. The larger markets are not saying this, and the vol percentile is telling me that there is room for volatility is mean revert. These conflicting signals give me an interesting volatility relationship that I could trade. So, I have interest in selling the higher volatility (SPY) and buying the lower volatility (IWM/QQQ).

Chart of RVX (Russell Volatility (IWM)) - VIX (SPX Volatility (IWM)):
 So what I am doing is buying this pair. Now this chart doesn't show all the opportunity because it is not illustrating the high IV_Percentile. If we were to trade this pair there are a couple ways have doing this. The first was is selling an SPY iron condor and buying a IWM double Diagonal. This is a pure volatility trade. I prefer to trade this pair factoring in direction because the markets have fallen very quickly. Considering direction, I am going to want to be long delta in the index I want to sell volatility (vol goes down into up moves), and I want to be short delta in the index I want to be long vol in. Below are some possibilities to do this trade.

  1. SPY: Sell a put and IWM: Buy a put
  2. SPY: Sell a wide put spread and IWM: Buy a wide put spread (same width of strikes)
  3. SPY: Sell a skewed iron condor and IWM: Buy a skewed double diagonal
  4. SPY: Sell a put spread and IWM: Buy a short duration directional Diagonal (Long ITM back month and short OTM front month (Puts))
(You will want to skew these trades considering your directional or how strong your volatility bias is.)


Tuesday, January 14, 2014

More Vol Coming? Probably?

We just had a 25 point down move in the /ES. Implied volatility jumped up to 13 (a level still below the mean), and the markets started looking slightly bearish. A lot of options traders have been caught short the market, due to the low volatility. Therefore, large up moves are not always easy to stand for many professional options traders. I only have one warning. Do not get over excited. The markets are not showing signs of crashing down. However, volatility is slowly rising. As I said before, the markets will go down with everyone least expects it. I only say do not get over excited, but as earnings season is back, there is volatility back on the board. My own personal hope is the VIX slowly creeps up, and causes some panic. We then will see much more interest in the markets. I will leave you with a few interesting stocks. DOW, FB, and TWTR. I have been playing these stocks like crazy with all this high volatility. I have also amassed some pretty large positions. I continue to sell weekly directional premium in these while being short iron condors in the back month (FEB 38 days to expiration). However, it is easy to get too big. The most promising of three right now is TWTR. I would give it until earnings for  great opportunity, and after then the volatility most likely get crushed. I would still like to be able to play TWTR for a while, if possible.

Thursday, January 9, 2014

Hints for More Oppurtunity

2013 was a really tough year for traders, specifically strategic traders. The markets did almost nothing but go up, and we had no volatility. We only had a few days where the VIX went above it annual mean in the last year. An environment like that gives us very little opportunity as traders. It was very difficult to take advantage of volatility because it rarely became overextended and direction is hard to deal with all by itself. However, I am starting to see some more opportunity on the board. I have scrolled through many stocks on my platform, and slowly the volatility ticks up more and more. I think we are going to see some volatility expansion very soon, and we will likely see a sell off in the ES. My position has become short delta, but I am still making money almost every day this year. That is weird. However, that might be a reflection on some of the opportunity out their. I am been seeing some very interesting premium crushes. The main stock I am watching is TWTR. It is a relatively new stock so the volatility is pumped. My general game plan is to be short volatility while getting slightly short or long delta considering the move. If TWTR falls a bit I am long some delta (At the current time selling some weekly put spreads), or if TWTR goes up a bit I will be selling call spreads. At the moment, I am short weekly put spreads, short call spreads in the front month, and short an iron condor. This stock will only have such pumped vol for a few more week, so take advantage of the opportunity available. Otherwise, I am short delta, short premium, and long index volatility (Vix is an example). The only really interesting stocks/markets right now are CMCSA, MSFT, and DOW. Sell some premium in these, stay small, but remember there is some new volatility opportunities starting to come in; therefore, be watching and be careful with earnings.

Monday, December 30, 2013

Once Again Short Delta

I have once again moved my delta short. For the last several weeks, I have kept my position between flat and short. Why have I moved short again? The answer is tail risk. The market is so high and overblown that you have a ton of risk to the downside. The Vix almost tested it's 11.4 low again this year, and it is trading at 12.46 now. You have to expect the market to revert with volatility at such a low level. We are also starting to see rotation into junk. You have crappy stocks like BBRY, CLF, JCP, and WLT up, but you have market leaders like AAPL, GOOG, TWTR, AMZN, or BIDU down or not going up. When we have this rotation we are almost alway near a top, but that perspective is subjective. However, being strategic and mechanical is more important than your direction. Stay strategic not directional, but their is a certain amount of room for delta risk. Therefore, I will not "load them up", but their is good reason not be long this market. When you have VIX at 12.46 you almost always will get some sort of reversion. Maybe we get a 5-7% correction in the next couple of week that may be it, but it could easily be 10-15%. Just because we are all getting back from Christmas vacation doesn't nothing can happen.

Here is an interesting statistical study on the market falling in the next few days:

Wednesday, December 18, 2013

Broken Wing Butterfly For Earnings


As most traders know, volatility gets inflated before earnings, and it gets inherently crushed after the binary event risk (earnings) goes away. When volatility goes down with binary event risk options prices get crushed especially in the front month and weekly options that have the shortest duration. Large account have many more options when it comes to earnings trades because of the amount of undefined risk they can take. However, with people with smaller accounts the options are more limited because they can not take the risk of a naked options with earnings. So the question is how can you get some of the exposure of a strangle/iron condor and a directional credit spread. So if we consider the butterfly it is a low probability of profit non directional spread. However, with a broken wing butterfly we skew it to our direction. In the example above, we sell 2 ATM options, and then we buy an options 1 strike further OTM. Then we add on an ITM option  that is two strikes away from the short ATM options. This skews the spread into our direction with a peak at a non event. What this also does is it embeds a credit spread with the short ATM options and the long OTM option that has a high probability of success. We then are long an ITM option that functions like stock (50% probability of profit), and volatility does not affect these options very much. Then if we apply this trades to earnings the ATM and OTM prices get crushed especially if the stock stays flat or goes our way. Then what happens is because of that premium crush the peak expands, and we have a greater range of higher then we might otherwise get with the spread. This is one of my favorite earnings trade because of the peak expanding. What you do is give yourself a high probability of success while getting a lot more profits that a trader might expect from just a short credit spread. 

Saturday, December 14, 2013

Current Situation Study

This is an excel study I put together considering the VIX and the SPX.  These are the results.

Friday, December 13, 2013

Unfortunately Vix May Stay Low

Yes, it look looks like VIX may stay low again, and it will most likely drive market up. When Vix does blow through 16 it usually doesn't go much farther, and the down move doesn't continue. Therefore, I have kept out of short US equity (SPY,IWM,QQQ), and I have simply been selling premium in some high vol individual stocks. Also, earnings plays have been really good. Personally, my favorite strategy for earnings right now is the broken wing butterfly (I will talk about this in a later article). I have been short some crappy invid stocks (BBRY for example), and I have been short international stocks with the main short in EWW. I do have one big delta short US position and that is QQQ (Long a put spread). I will be closing out that winning position today. Other than that, I am also selling quite a bit of gold premium. These gold position have been tormenting my account due to the large daily swings in gold. However, gold have been a great trading product as it constantly mean reverts, but if you want to trade it you have to stay very small and understand your risk from a correlation standpoint. As in you have to understand what it means to be short puts in gold miner XYZ, then short a put in gold, and then long covered calls in a random silver stock. These position will all correlate and could easily be dangerous to your account if you don't understand this risk. Also, by the end of the weekend expect me to have a study posted about some of the action in the VIX versus the SPX to see if we can find any directional interest. Just remember to always apply a strategic play before a directional one. Duration over Direction......

Tuesday, November 26, 2013

Longs Beware of the Vix!

Usually I have some wise man tape reading words, but today I do not (my terrible attempt at comedy). Anyway the markets are mixed you have some major stocks down (TSLA, XLE, GMCR), but then there are some stocks that are are strong (FB, AAPL, GOOG), but my watch list seems pretty mixed. The RUT and Nasdaq are leading and the S&P is simply following. I think we will see danger when no one expects it. Beware of the VIX! Until then wait for the higher vol to sell and stay small.

Saturday, November 23, 2013

Considering tough markets......

 Take a look I talked a bit about tough markets:
http://www.ustream.tv/recorded/40894342